One connected workflow
A confirmed outage opens an incident, alerts your channels, and updates the services you publish.
Watch your services, catch confirmed outages, and keep customers in the loop. Explore the tools that connect every step.
3 free monitors · No card · No trial period
 View full size
 A confirmed outage opens an incident, alerts your channels, and updates the services you publish.
Outages and recoveries need a second check after 30 seconds. One failed check does not open an incident.
3 monitors, one public status page, and email and Slack alerts. No card and no trial clock.
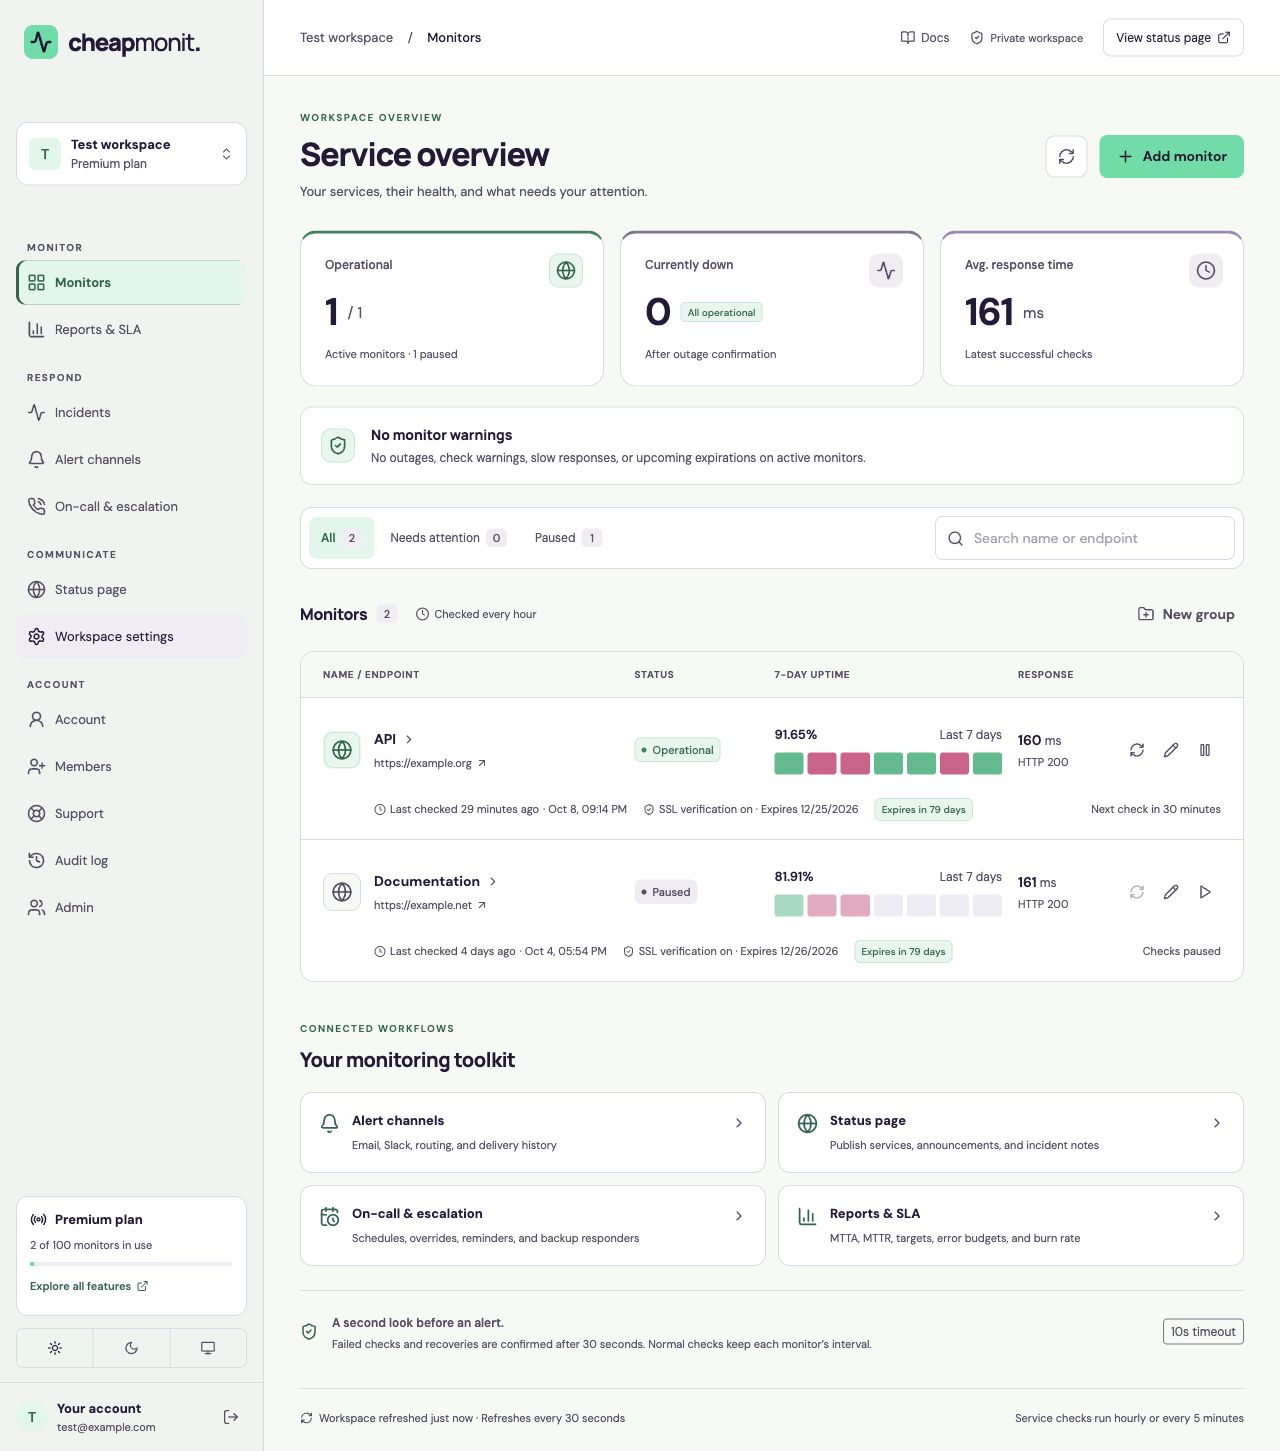
Availability, response times, and upcoming expirations in one view. Check history gives you the detail behind each result.
Check public HTTP and HTTPS services hourly on Free, or every 5 minutes on Premium. See status codes and response times; checks have a 10-second timeout.
Choose GET or HEAD, expected status codes, a required response keyword, and up to 10 custom headers for authenticated endpoints.
Verify certificate trust, hostname, and validity. See the expiry countdown and get a warning 1–60 days before renewal is due.
Check public TCP connections and UDP ports. A UDP check can send a payload and require a reply; a connection check does not validate application behavior.
Daily registration lookups warn 1–60 days before domain expiry and when the registrar changes.
A daily Google PageSpeed Insights measurement of the page as a phone loads it: the performance score and the Core Web Vitals (LCP, INP, CLS), with 90 days of history.
Set a threshold between 100 ms and 10 seconds. A successful check above it sends one alert, without counting as downtime.
A response-time chart and a table of each monitor’s latest 200 checks, with exact results and errors, plus 7, 30, and 90 days of uptime.
Run a monitor’s next check now instead of waiting for the schedule, up to once a minute per monitor.
Organize monitors into as many groups as you need. Pause a monitor during planned work; paused time is left out of its uptime.
Receive confirmed outages and recoveries, slow response warnings, and expiry alerts. Follow each delivery and choose where each monitor sends its alerts.
Your own address from the start. Other addresses confirm with an emailed link before they receive alerts.
Post alerts to a channel through a Slack incoming webhook.
Every alert as JSON to your HTTPS endpoint, signed with HMAC-SHA256 so you can verify the sender.
Alerts as notifications in your browser or on your phone, even with the dashboard closed. On iPhone and iPad, add cheapmonit to the Home Screen first.
The person on call is emailed every alert during their turn.
Up to 20 channels per workspace. Test a destination and inspect delivery attempts; failed deliveries retry up to 10 times.
Set up routing and delivery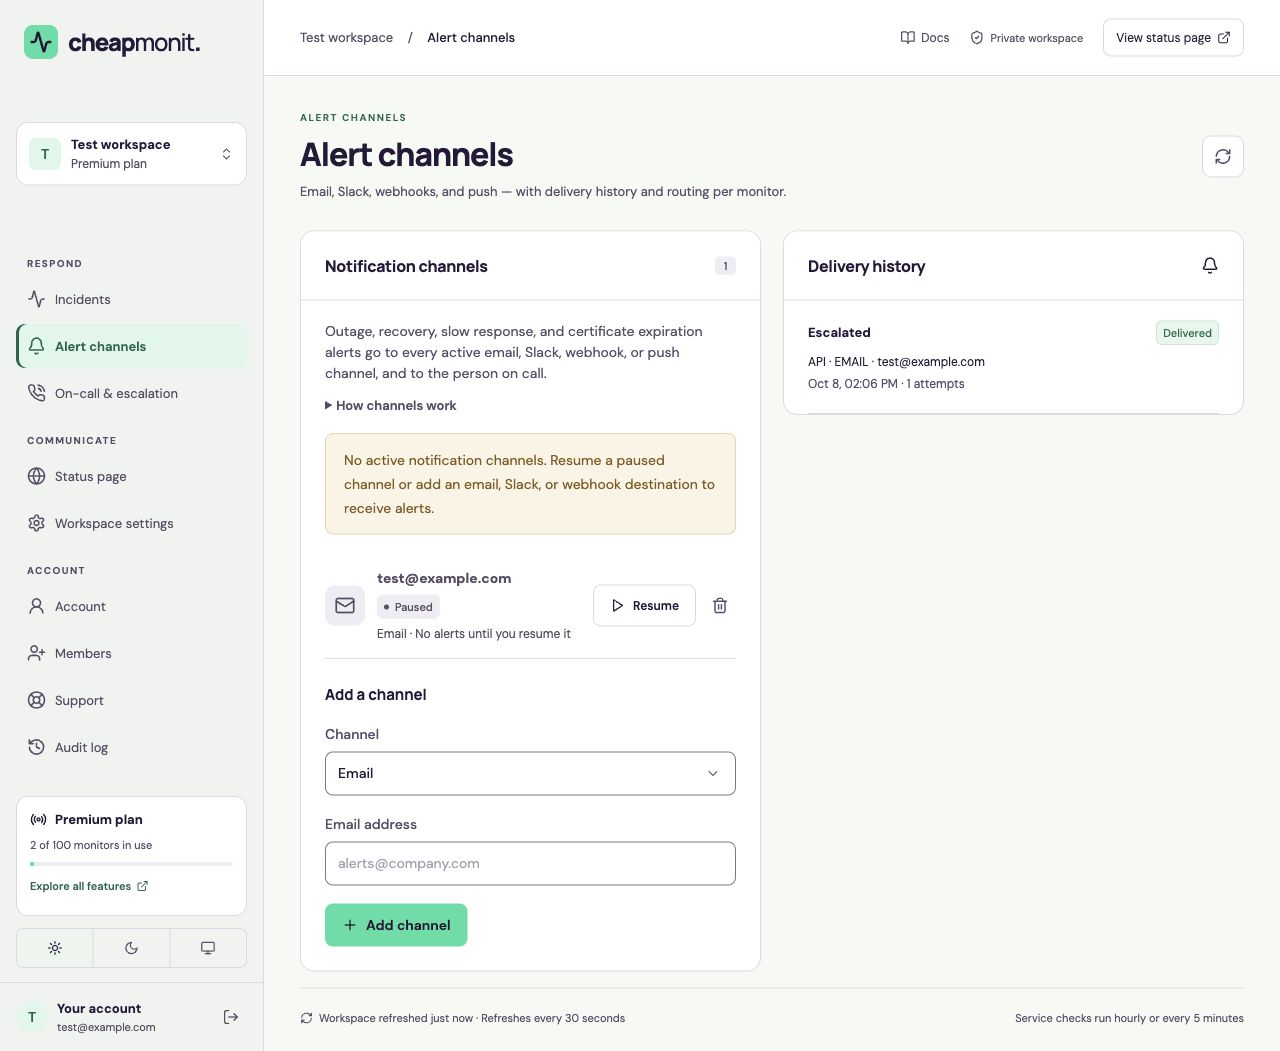 View full size
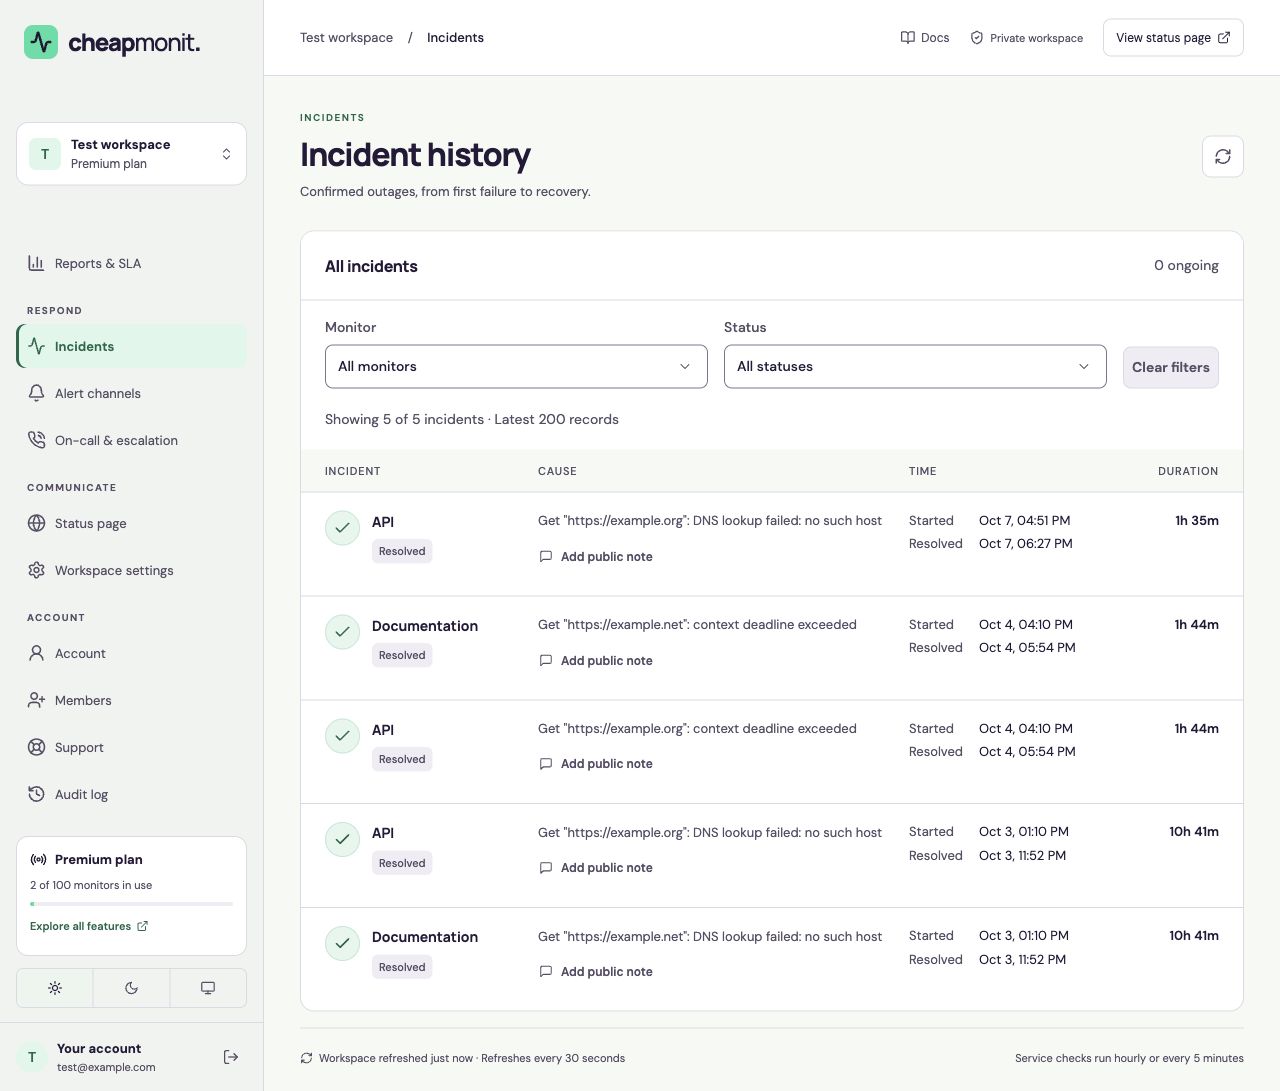
 Confirmed outages open incidents automatically. Follow recovery privately and share the context your customers need.
A confirmed outage opens an incident without manual triage. Repeated failures stay in the same incident.
A confirmed recovery closes the incident and records how long the outage lasted.
Each incident keeps the failing check’s result and error, visible to your workspace only.
Add a note of up to 500 characters to tell visitors what happened, on the status page and its feed.
Filter incidents by monitor and by ongoing or resolved.
Take ownership in the dashboard or through an eligible email or Slack alert link. Record who responded and when, and stop further escalation. Acknowledgements stay private.
Availability is calculated from confirmed outage time, not from the number of failed checks.
 View full size
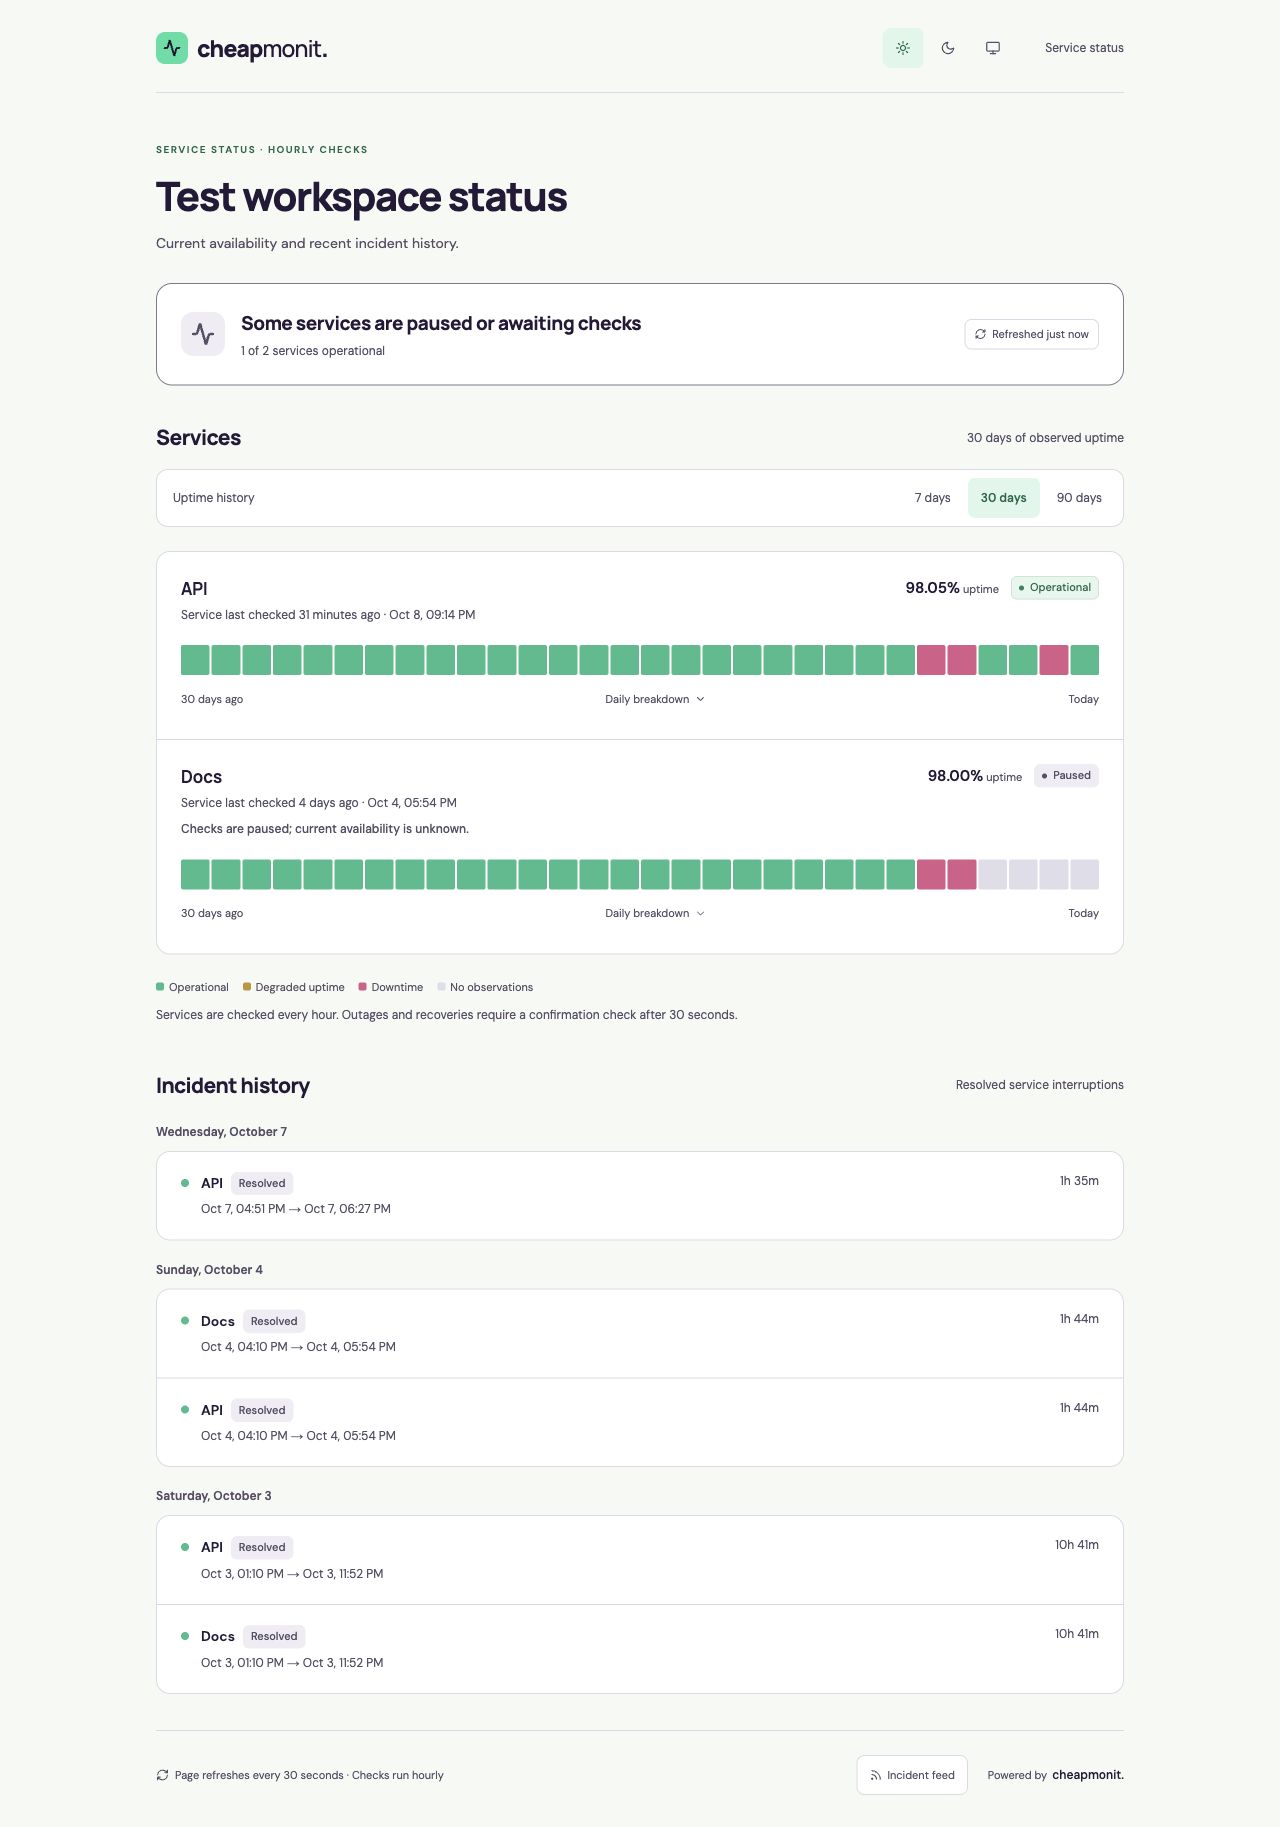
 Publish the services you choose, with availability and incident history that update from your monitors. Private addresses and check errors stay in your workspace.
Publish the services you choose at your own link. Monitor addresses and check errors stay private.
Group services under headings and give each a public name, in the order you want.
7, 30, or 90 days of daily uptime, calculated from the monitors behind each component.
Outages appear on their own, with an optional public note. Post an announcement that can expire by itself.
An embeddable SVG badge and an Atom feed for every page.
Up to 10 status pages in one workspace, each with its own link, services, access, and branding.
Keep a status page for staff or customers only, behind a password.
Your logo and accent color, with “Powered by cheapmonit” removed.
 View full size
 Want a live example? See cheapmonit’s own status page
See how quickly your team responds, track availability targets, and understand the downtime your error budget still allows.
Mean time to acknowledge and to resolve over 7, 30, or 90 days, for the workspace and for each monitor.
Hold a monitor to 99% to 99.99% availability. See how much downtime the target still allows, and the burn rate of the last 24 hours.
Reports cover 7, 30, or 90 days. Availability and error budgets use observed time; paused and pending periods are excluded. Burn rate is reported, without triggering alerts.
Understand availability and error budgets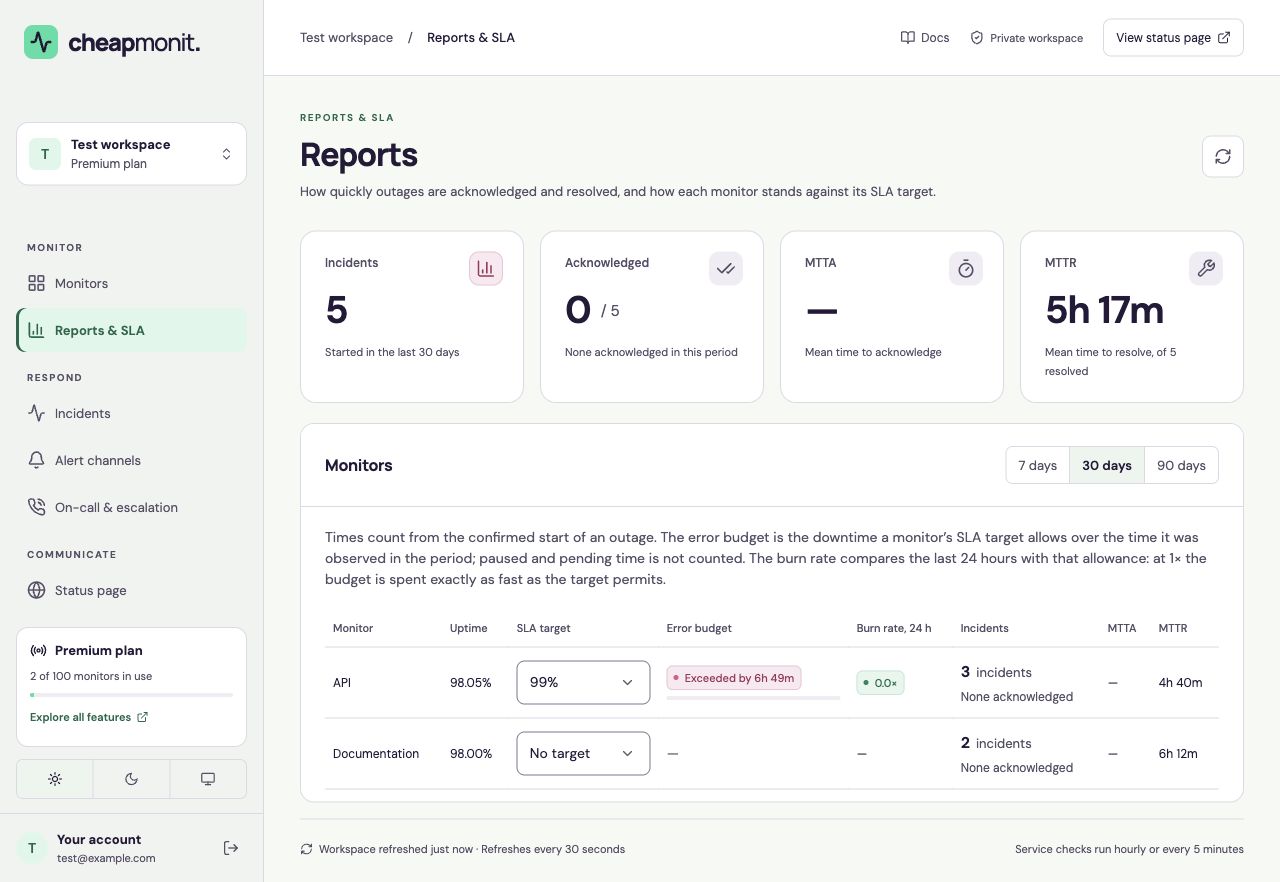 View full size
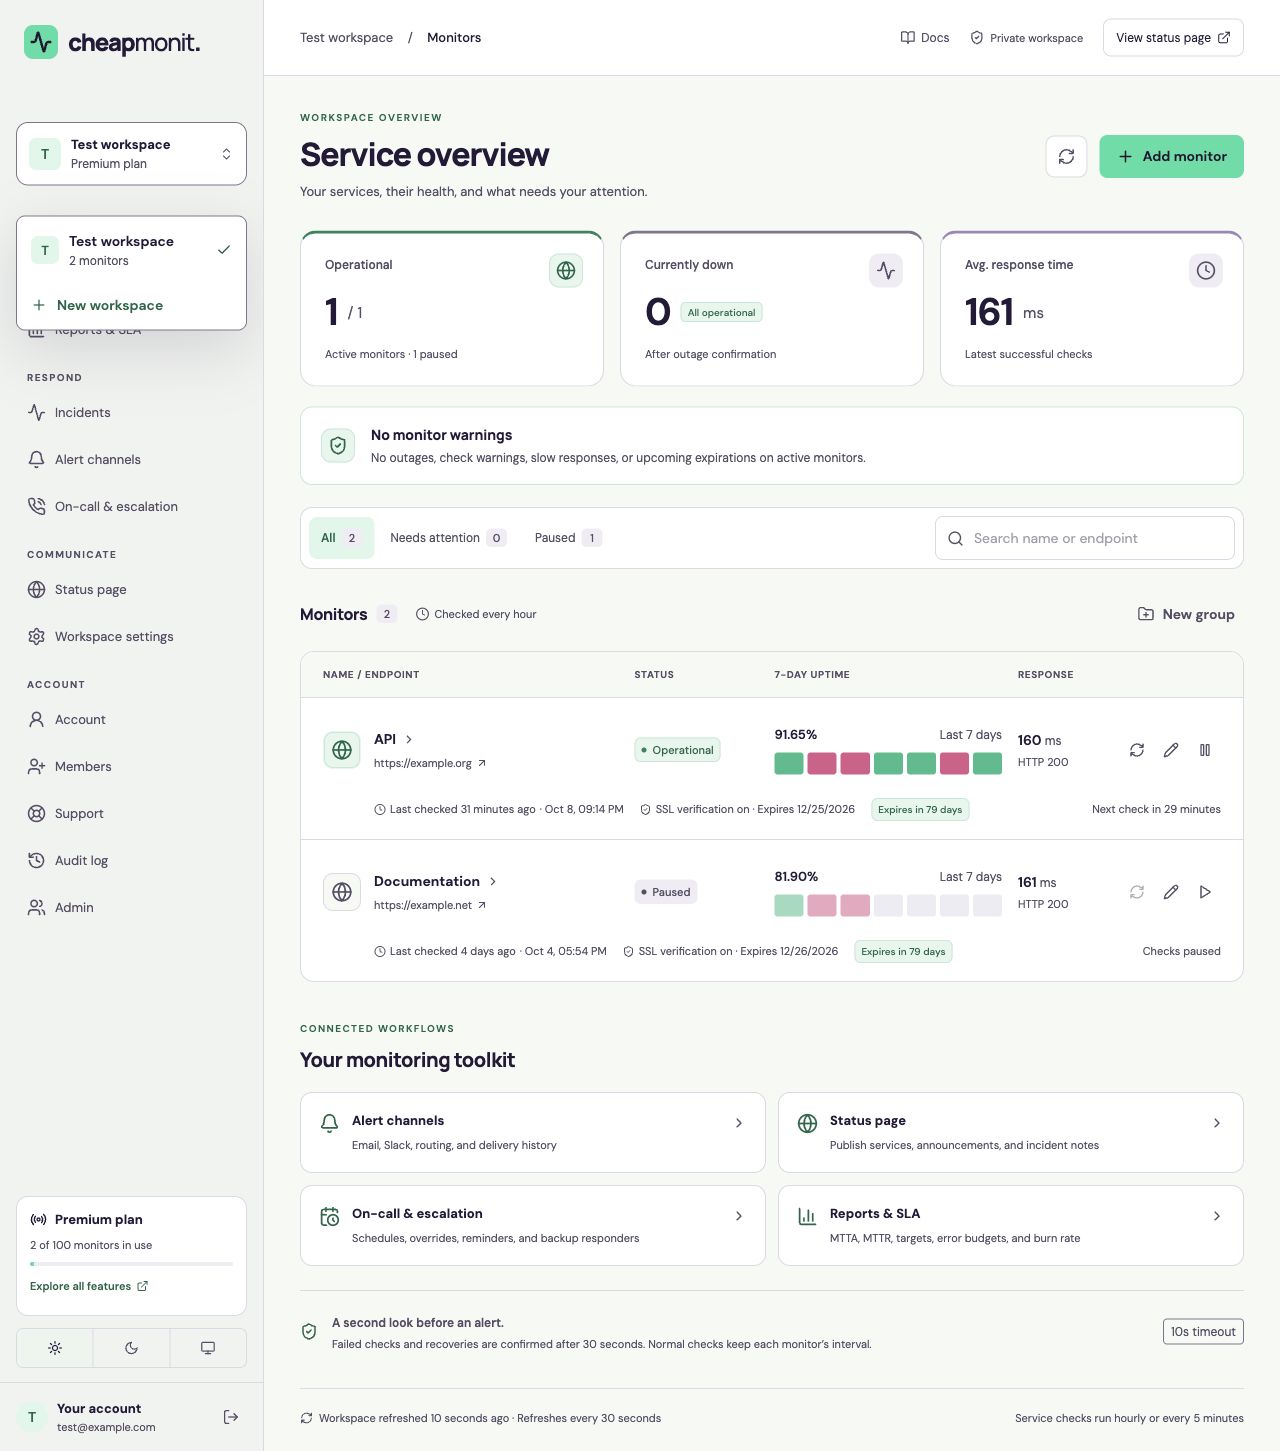
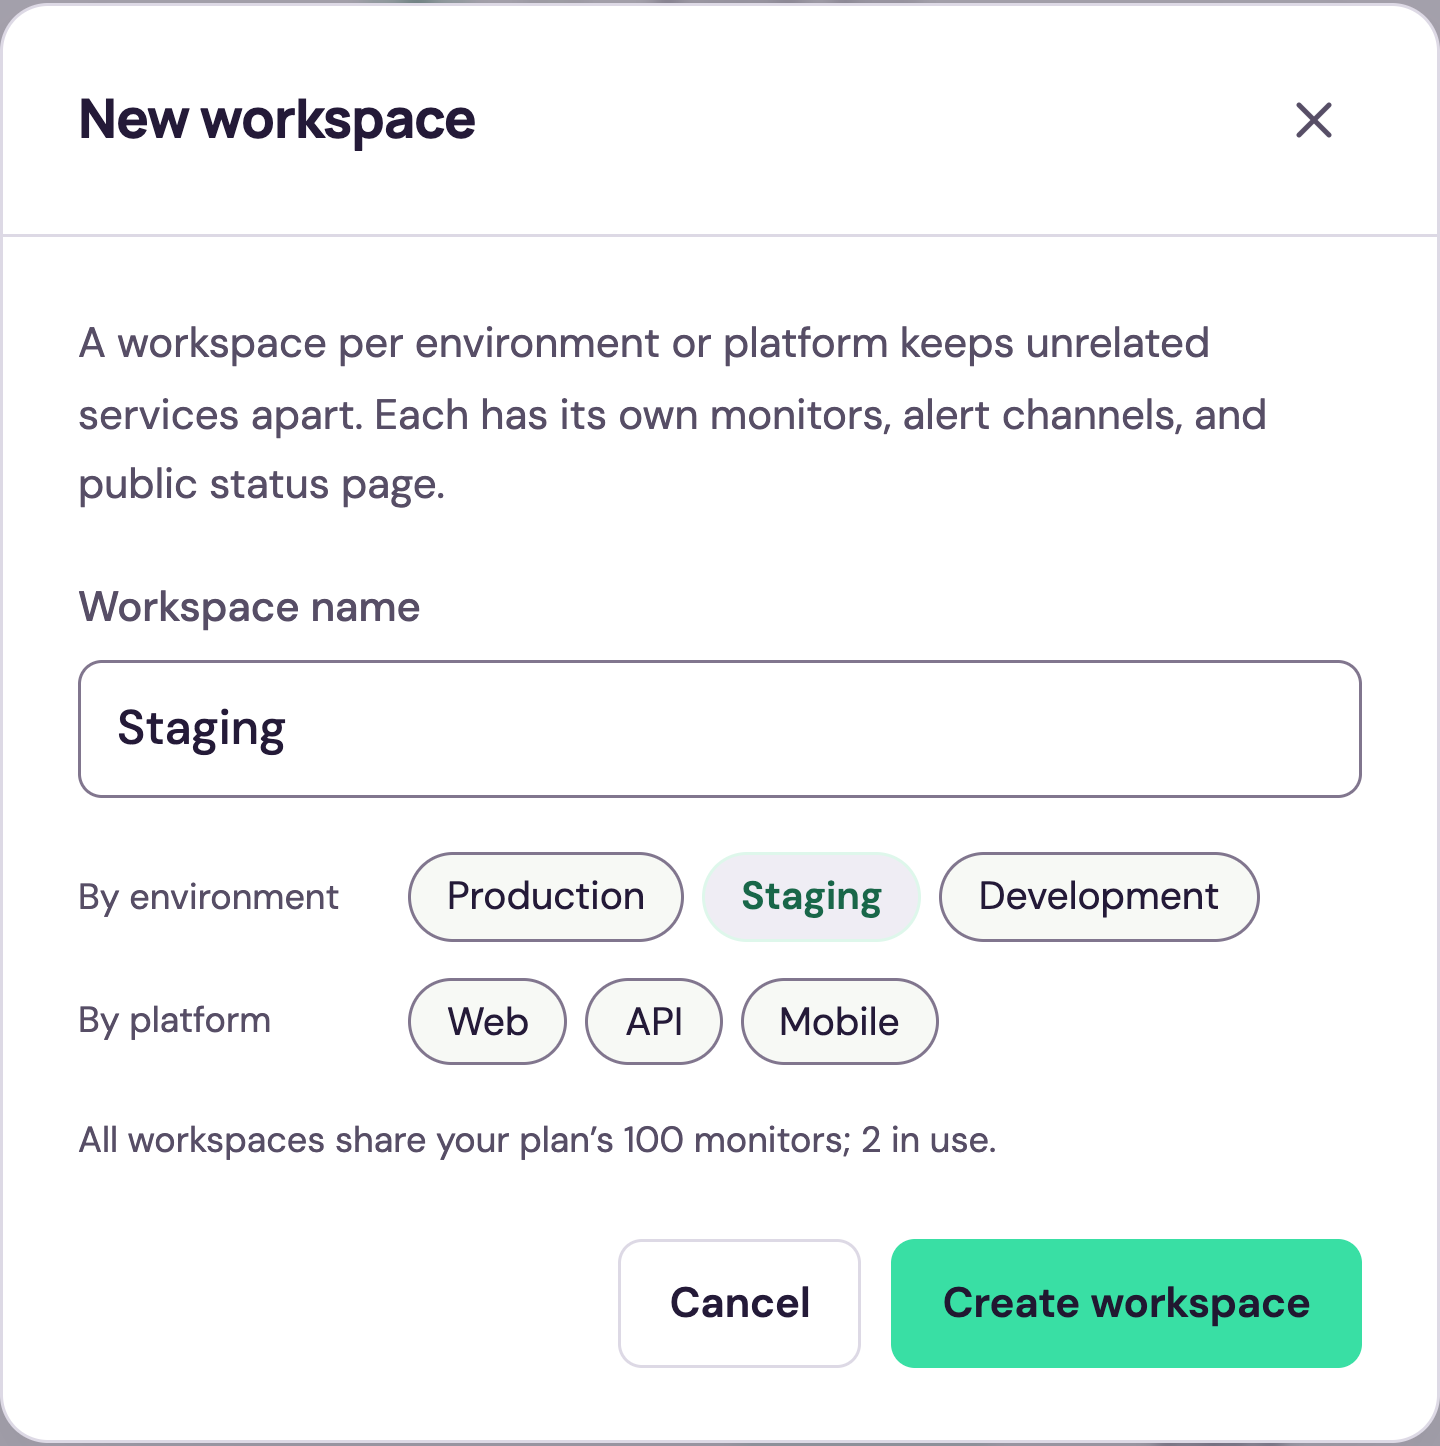
 Separate production, staging, or a platform into its own workspace. Switch context without mixing monitors, alerts, incidents, or status pages.
Each workspace has its own monitoring and response settings, plus one status page.
Invite people to one workspace or all of them. Members have full access where they are invited.
Free: 1 workspace and 3 monitors. Premium: up to 10 workspaces sharing 100 monitors, including paused ones.
 View full size
  View full size
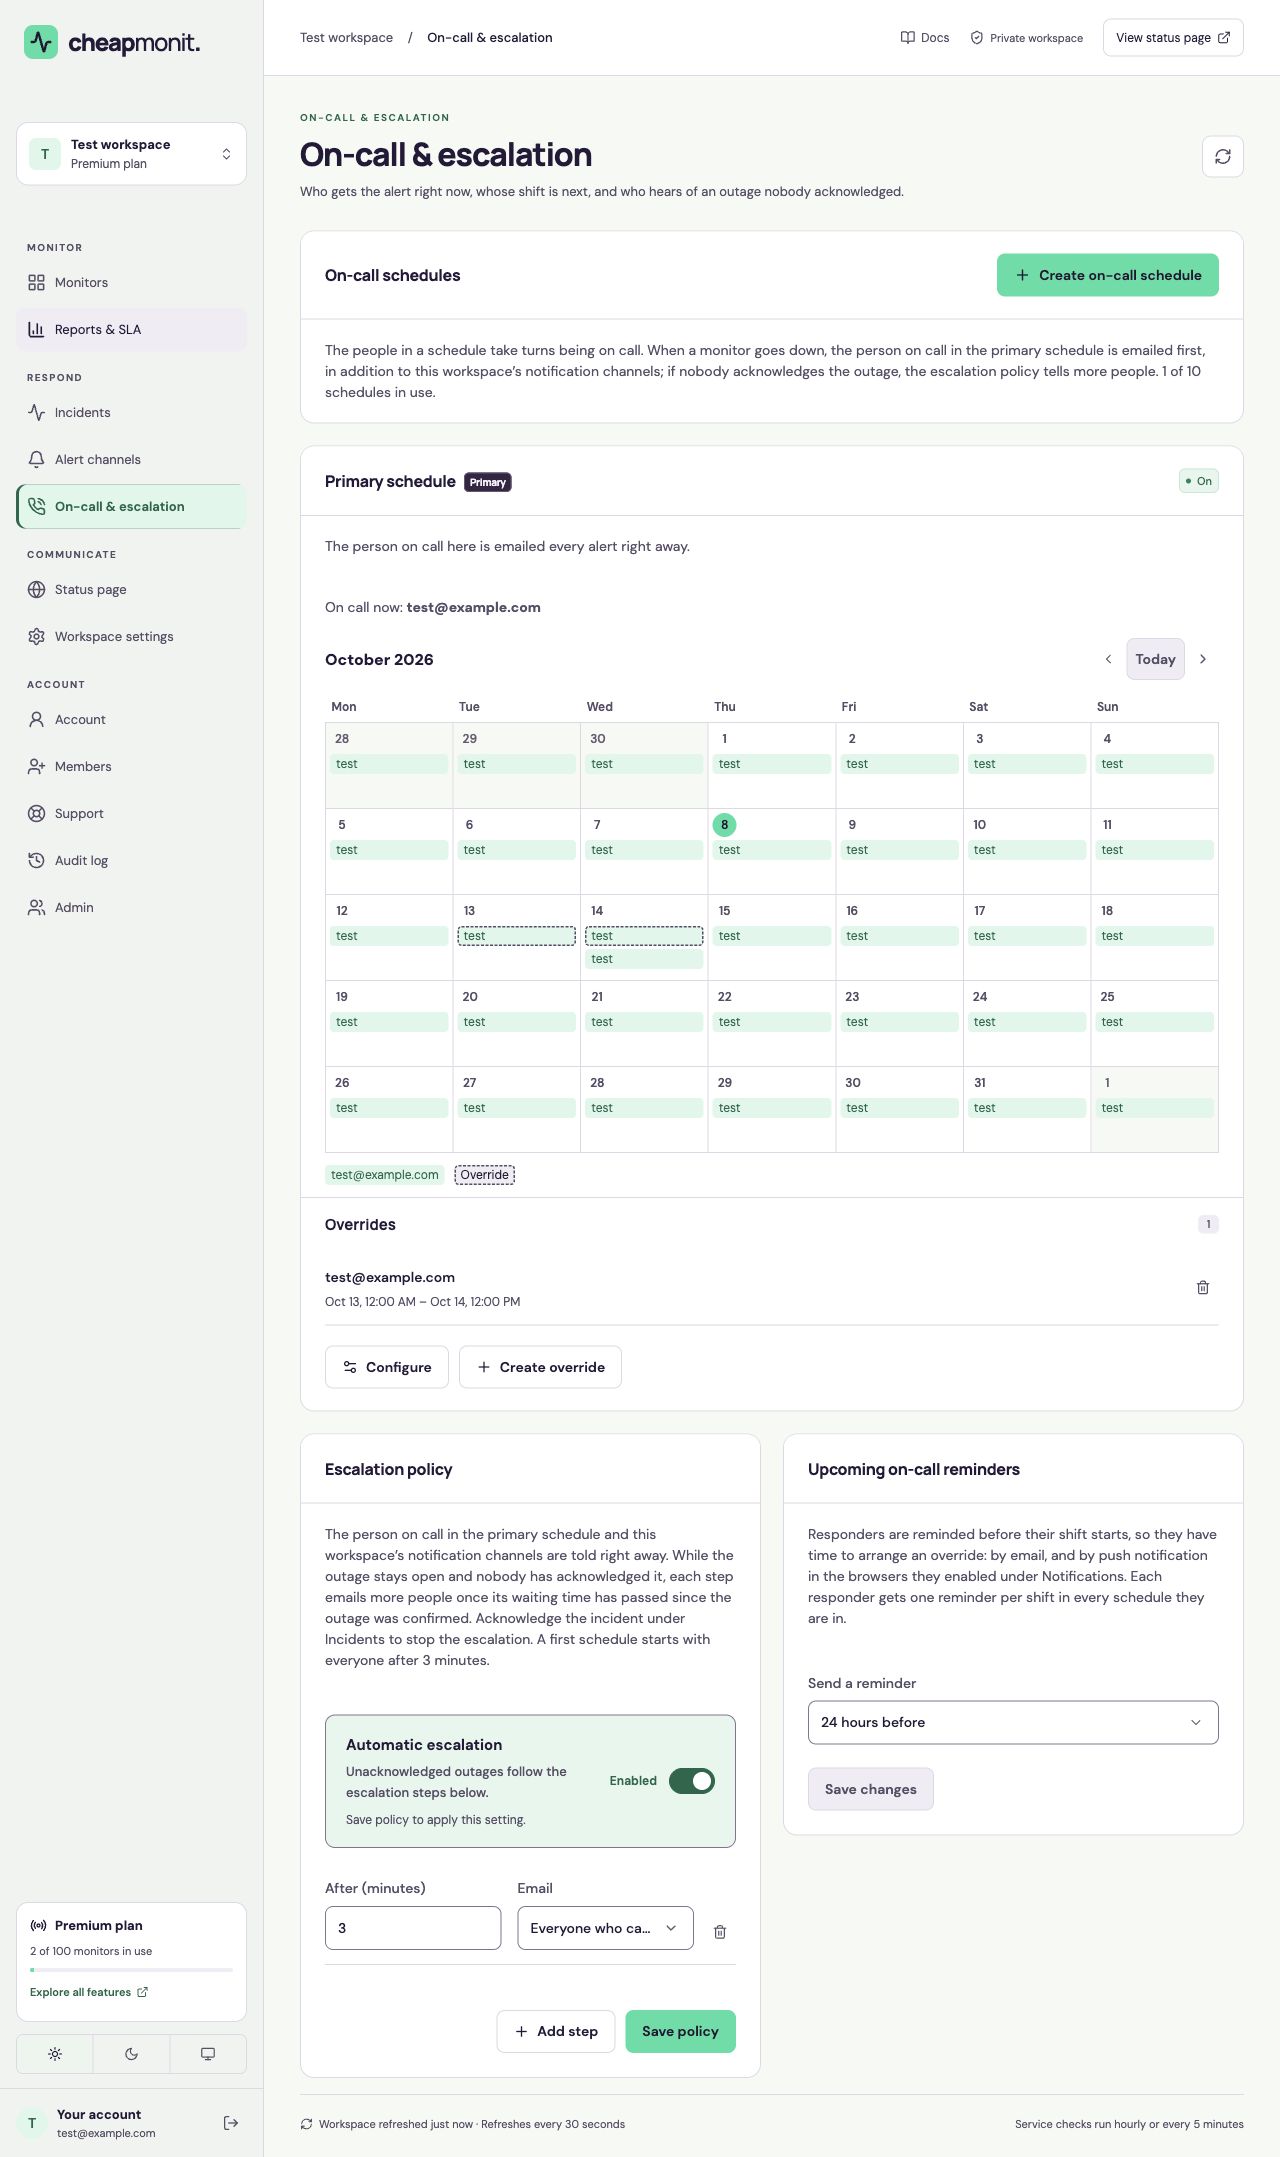
 Arrange the responder rotation, reach backup responders, and keep a record of changes across your account.
Rotate responders every 1–28 days across up to 10 schedules. The primary schedule receives alert emails; overrides cover time away and reminders prepare the next responder.
Reach a backup schedule, a person, or everyone through up to five timed email steps. An acknowledgement stops further escalation.
Invite up to 30 people by email. A member works in all of your workspaces, or only in the one you choose.
Every monitor alerts every active channel by default. Mute channels per monitor, or pause a channel altogether.
Every change to your workspaces and account: who made it, what changed, and when.
Open a ticket from the dashboard and follow the replies there.
 View full size
 Checks run from one location against public addresses. Premium’s fastest interval is 5 minutes. Custom domains, heartbeat monitoring, and SMS are not available.
These capabilities are unavailable on every plan. No release dates have been announced.
Once an hour on the free plan, and every 5 minutes on premium if you choose. A failure or recovery is confirmed by a second check 30 seconds later, and you can run a check on demand.
From a single location. Checks from several regions are not supported yet, so an outage is confirmed by a second check from the same place.
Yes. You choose the services, their public names, sections, and order, and can post an announcement. Password protection, your own logo and color, and removing “Powered by cheapmonit” are part of premium. Custom domains are not supported yet.
Email and Slack on every plan, up to 20 channels per workspace. Premium adds signed webhooks, push notifications to your browser or phone, and email to the person on call. Microsoft Teams, Discord, PagerDuty, Opsgenie, and SMS are not supported yet, and there is no native mobile app.
No. Checks connect to public addresses only, and private, loopback, and reserved addresses are refused. An endpoint that needs credentials can be checked with custom request headers.
3 monitors, email and Slack alerts, and one public status page. Free for as long as you like.